01 Economic Growth and Development
Why are some countries are rich and why some are poor?
How do you define and measure development?
Development is the process of improving the material conditions of people through diffusion of knowledge and technology. A More Economically Developed Country or (MEDC)is a country that has progressed relatively far on the development continuum. Whereas a Less Economically Developed Country or (LEDC) is a country in an earlier stage of development. (Also sometimes called a developing country) Development is often measured by a country’s Gross Domestic Product or (GDP) which is the value of the total output of goods and services produced in a country per year. But, measuring development is not straightforward. It can be misleading to look at one single wealth indicator like GDP per capita because the wealth of a country might not be shared out equally. Also, one country might be seen as very developed when using one indicator, but far less developed when using a different indicator. Therefore, social scientists use both economic and social indicators when measuring development.
|
|
|
Generally, most more economically developed countries (MEDCs) are in the northern hemisphere and most less economically developed countries (LEDCs) are in the southern hemisphere. There are exceptions such as Australia and New Zealand. The Brandt Line is an imaginary division that has provided a rough way of dividing all of the countries in the world in to the rich north and poor south. Many countries in the poor south have become more developed since the 1980s and so many people now think that the Brandt line is no longer useful. For example, some countries that are considered to be 'developing' have experienced rapid growth (especially in manufacturing and tertiary industries) in recent years. We call these countries the newly industrialized countries(NICs) eg China, Brazil and Mexico.
Employment structures
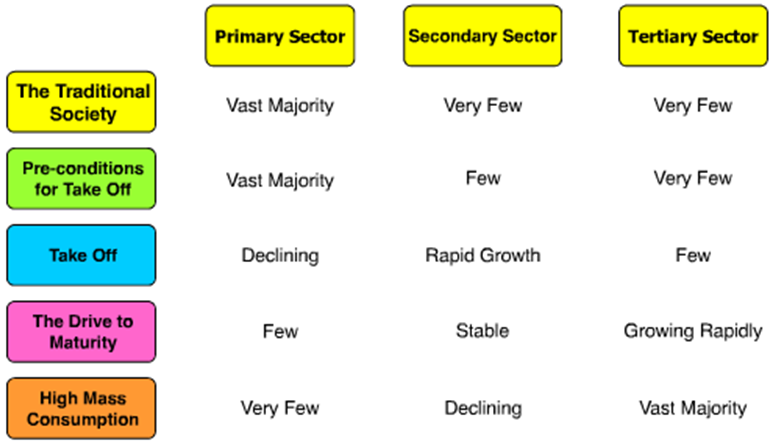
The employment structure of a country shows how the labour force is divided between the primary, secondary and tertiary sectors. Different countries have different employment structures. The employment structure of a given country can tell you quite a lot about its economy.
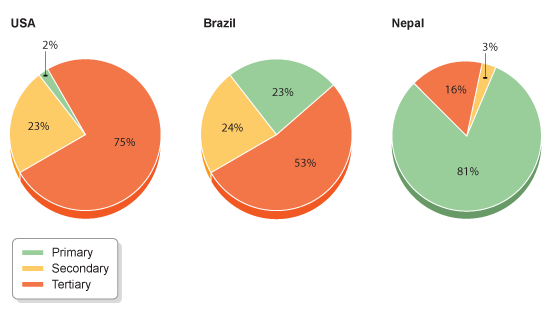
In the richest countries, for example, there will usually be more people working in the tertiary sector than in the primary and secondary sectors. In the poorest countries, there tend to be more people working in the primary sector than in either the secondary or tertiary sectors.
The primary sector involves the extraction of raw materials from the Earth. This extraction results in raw materials and basic foods, such as coal, wood, iron and corn. The types of workers in this sector include farmers, coal miners and hunters.
In the U.S. and similarly in most other modern world countries, there is a decline in the proportion of the population that works in the primary sector. Currently, only 3% of America's labour force is engaged in primary sector activity. This is a big change from the mid-19th century in which two-thirds of the labor force was engaged in this sector.
The secondary sector involves the transformation of raw materials into goods. This transformation results in wood being made into furniture, steel being made into cars or textiles being made into clothes, as examples. The types of workers in this sector include a seamstress, factory worker or craftsmen. The development into this sector can be attributed to demand for more goods and food, which leads to industrialization. Only so much can be done in the primary sector before there is a natural limit on how much can be extracted. When an economy moves into the second sector, new farm techniques are used, and industrialization changed how goods can be transformed, distributed and sold. Currently, 20% of the U.S. labour force is involved in the secondary sector.
The tertiary sector involves the supplying of services to consumers and businesses. This sector provides services to the general population and business, including retail, sales, transportation and restaurants. The types of workers in this sector include restaurant bartenders, accountants and pilots. The service industry makes up 80% of the labour force today.
Look at the diagram below. Based on the employment structure, which countries do you think are the richest and poorest?
Measuring Development Assignment
Assessment: Measuring Development - Student Sample
Close up on China

Traditionally most of China’s population of 1.3 billion has been employed in agriculture. This began to change in the 1980’s as Chinese cities such as Beijing and Shanghai became areas of massive economic growth, these areas were designated Special Economic Zones. Men and women left their lives in the countryside to take jobs in the cities hoping for more money and a better quality of life.These rural migrants often have to settle in slums on the outskirts of urban centers as there are few affordable homes; others stay with relatives creating cramped living conditions. Some migrant workers struggle to find work due to lack of experience and skills but most end up doing low paid work as employers need cheap labour. Migration in China often splits families up, children are left in their villages while their parents go away to earn enough money to them. These children will only see their parents once or twice a year. For the rest of the time they are brought up by relatives and family friends.
But this isn’t China’s only problem, with nearly 7 million people a year migrating to the urban areas, the environment is beginning to suffer. By 2020 more than half of China’s population will live in urban areas compared to just 26% in 1990. In just 30 years one quarter of China’s residents will have moved from the rural west to the heavily populated east. By 2050 western China may be very sparsely populated, with the majority of the population crammed into the east coast.
But this isn’t China’s only problem, with nearly 7 million people a year migrating to the urban areas, the environment is beginning to suffer. By 2020 more than half of China’s population will live in urban areas compared to just 26% in 1990. In just 30 years one quarter of China’s residents will have moved from the rural west to the heavily populated east. By 2050 western China may be very sparsely populated, with the majority of the population crammed into the east coast.
Cartoon Source Analysis
As part of your studies in grades 7 to 10 you will be required to master the skill of analyzing political cartoons. Everything drawn in a cartoon is included for a reason. You will practice identifying elements / symbols of a cartoon and then explain what message the cartoonist is trying to convey to the audience.
China's Resource Exploitation
Environmental Consequences of China's Development
|
|
|
Rostow's Model

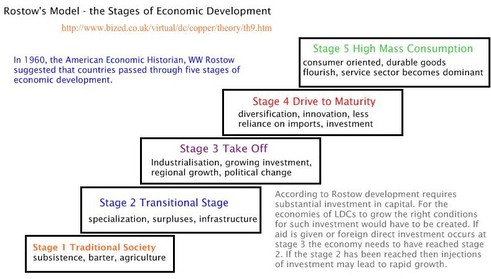
The Rostow Model of Development was created in 1960 by an American, W.W.Rostow. He based the Model, which represents economic development, on 15 countries - most of which were European - and suggested that it was possible for all countries to break the viscious cycle of poverty and develop through the 5 linear stages that construct his model.
Stage 1: TRADITIONAL SOCIETY
Stage 2: PRE-CONDITIONS FOR TAKE-OFF
Stage 3: TAKE-OFF
Stage 4: DRIVE TO MATURITY
.
Stage 5: AGE OF HIGH MASS CONSUMPTION.
Stage 1: TRADITIONAL SOCIETY
Stage 2: PRE-CONDITIONS FOR TAKE-OFF
Stage 3: TAKE-OFF
Stage 4: DRIVE TO MATURITY
.
Stage 5: AGE OF HIGH MASS CONSUMPTION.
Strengths:
- It provides a general path for development and splits this path into 5 stages. This enables countries to use it as a rough guide to development.
- To some extent all countries can be compared to it.
- It is easy to understand.
- In conjunction with the Demographic Transition Model, it can be used to generate population policies.
Criticisms:
- The model is quite old (created in 1960) and, perhaps, oversimplified. Its age prevents it from taking into account new technological and scientific advances that have accelerated development.
- It is very Eurocentric and so perhaps reflects Westernization more than it does development as all countries develop differently and at different rates.
- The model makes the presumption that all countries start with the same foundations i.e have the same climate, amount of natural resources and same population size/structure and this is not in fact that case.
- Money is clearly needed for a country to move beyond stage 1 and often, nowadays this money is provided via international aid. However, debt repayments often restrict further advancements - something which is not taken into account in the model.
- This model is based on the development of countries like the UK. The development of the UK was, arguably at the expense of others, through colonialism. This model underestimates the importance of colonialism in the early development of many of the nations it is based on.
Effectiveness in the past and today
-Places such as the Maldives, Spain and New Caledonia have developed largely through Tourism not a switch from agriculture to manufacturing.
Key Points To Remember About Development:
Development happens in context: it is the combination of what is happening at a variety of scales concurrently.
When analyzing the development of a country we must consider what is happening locally, regionally and globally that affect that countries development. Local events which have had a regional or global impact are Greece defaulting on its debt (local) weakened the value of the Euro (regional) affected the value of other global currencies (global).


