Unit II: Producing and Consuming
During this unit we will examine:
- the principle of equilibrium price
- how demand and supply can determine the market price and quantity traded of a good or service
- how to derive and draw a market supply curve and a market demand curve
- price elasticity of demand and supply
- how governments can use taxes and subsides to influence the market price and quantities traded of different products.
Unit 2 Plan
Below is an up-to-date copy of the lessons you have taken throughout this unit. If you have been absent from school or think you are missing any worksheets or handout please check it and then contact me.
| Economics Unit 2 Printable Version |
What is demand?

The want or willingness of consumers to buy a product. To be an effective demand a consumer must have enough money to buy the product. The amount of a good or service consumers are willing and able to buy is known as the quantity demanded of that product. Economists measure the quantity demanded of a particular good or service at a certain price over certain periods of time, e.g. the number of oranges bought per week. Individual demand is the demand of one consumer, while market demand for a product is the total demand for that product from all of its consumers
Demand Curves
The demand curve is a graph illustrating how much of a given product a household would be willing to buy at different prices
Key Point Summary
•Consumer demand for a given product is the want or willingness of consumers to buy that product. An effective demand only exists when consumers have sufficient money to buy the products
•The market demand for a good or service is the total effective demand of all consumers willing and able to buy that product
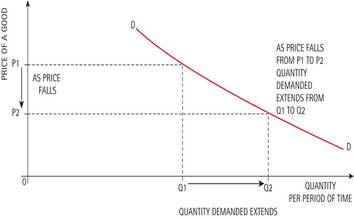
•Individual and market demand curves are downward sloping. As price rises, demand contracts. As price falls, demand extents as consumer can afford to buy more with their income.
Demand Curves
The demand curve is a graph illustrating how much of a given product a household would be willing to buy at different prices
- As price rises, the quantity demanded by consumers contracts
- As price falls, the quantity demanded by consumers extends
- A demand curve slopes downwards
Key Point Summary
•Consumer demand for a given product is the want or willingness of consumers to buy that product. An effective demand only exists when consumers have sufficient money to buy the products
•The market demand for a good or service is the total effective demand of all consumers willing and able to buy that product
•Individual and market demand curves are downward sloping. As price rises, demand contracts. As price falls, demand extents as consumer can afford to buy more with their income.
Movement Along The Demand Curve = A change in the quantity demanded
A change in price of a good or service leads to:
- Change in quantity demanded
A Shift In The Demand Curve
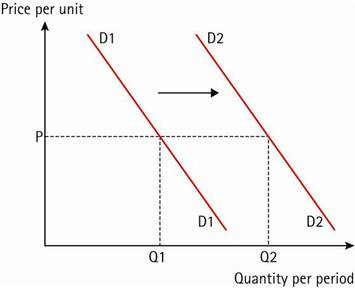
Change in income, preferences, or prices of other goods or services
leads to:
leads to:
- Change in demand
- Possible causes are:
an increase in disposable incomes after tax - a rise in the price of substitutes •
- a fall in the price of a complement
- •tastes and fashion favour the product
- •an increase in advertising •
- a rise in the population •
- other factors, e.g. hot weather increases demand for cold drinks and sun creams
Movement along the supply curve = A change in the quantity supplied
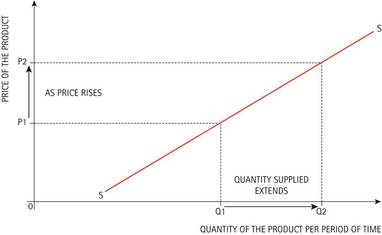
A change in price causes a movement along the curve
- The higher the price of a product, the more suppliers will produce..
- If the price rises then supply will rise, this is known as anexpansion in supply.
- The lower the price of a product the less will be supplied.
- If the price falls then supply will fall, this is known as an contraction in supply.
A Shift in the Supply Curve
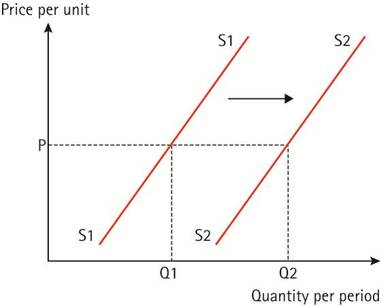
A shift in the supply curve represents an increase or decrease in the quantity supplied at each and every price level. Several factors that can cause a shift in supply:
- Improvements in technology (can increase efficiency & reduce costs).
- Weather, climate and disease (especially agricultural products).
- Taxes and subsidies can make the costs of production more/less expensive and therefor increase or decrease supply.
- Natural disasters & wars can severely disrupt supply.
- Resources: discoveries of new resources or depleting reserves of resources can affect the supply of products..
Market Equilibrium |
Normal and Inferior Goods |
Practice Exercises
Complete the following exercises to identify determinants of demand and whether the following scenarios result in a change in the quantity demanded (movement along the curve), or a change in demand (shift in the demand curve).
Review Materials
Review of work completed in Unit II up until Monday, Oct 15th
|
|
| ||||||
