02 Where are all the people?
7 Billion
|
|
|
|
November 15, 2023 is the day of 8 billion
The Industrial Revolution and World Population Growth
Population Growth and Resource Depletion
|
Peak oil is the point in time when the maximum rate of global petroleum extraction is reached, after which the rate of production enters terminal decline.
Optimistic estimations of peak production forecast the global decline will begin by 2020 or later, and assume major investments in alternatives will occur before a crisis, without requiring major changes in the lifestyle of heavily oil-consuming nations. Pessimistic predictions of future oil production operate on the theory that either the peak has already occurred, we are on the cusp of the peak, or that it will occur shortly and, as proactive mitigation may no longer be an option, predict a global depression, perhaps even initiating a chain reaction of the various feedback mechanisms in the global market which might stimulate a collapse of global industrial civilization, potentially leading to large population declines within a short period. An Analogy of Peak Oil:
|
|
Population Structure

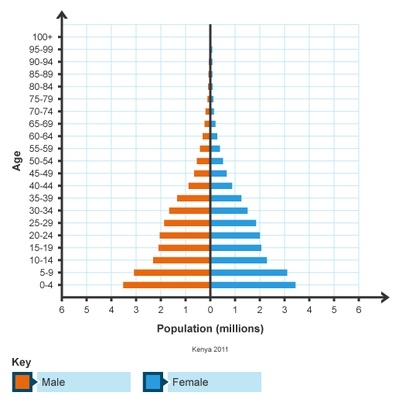
Population pyramids are graphs that show population structures, ie how many males and females of different age groups are in the population in each place. Population structures change from place to place and over time.
The population pyramids for the country on the right are different shapes. The pyramid for Kenya has a very wide base. This means that there is a high proportion of young people. The top is quite narrow which means there are fewer people in the older age groups. This type of pyramid is more likely to occur in a developing country where birth rates are generally higher.
What can we tell about the population structure of the shape of population pyramid?
Some reasons for high birth rates include:
The population pyramids for the country on the right are different shapes. The pyramid for Kenya has a very wide base. This means that there is a high proportion of young people. The top is quite narrow which means there are fewer people in the older age groups. This type of pyramid is more likely to occur in a developing country where birth rates are generally higher.
What can we tell about the population structure of the shape of population pyramid?
- A wide base means there are lots of young people, and suggests a high birth rate.
- A narrow base means a smaller proportion of young people, suggesting a low birth rate.
- A wide middle, tall pyramid means an ageing population, suggesting that there is a long life expectancy.
Some reasons for high birth rates include:
- need for large families, eg to work in rural areas
- lack of family planning
- people have many children because many infants die
- increasing wealth
- better hygiene and improved healthcare
- better farming techniques
Assessment: Migration Investigation
China's annual migration of 130 million people for the New Year holidays
The Demographic Transition Model

Person who developed the model/ theory: (short bio) Warren Thompson
American geographer, Warren Thompson, developed this model in 1929 in NYC in the midst of the stock market crash and onset of the Depression.
Premise: (What it is supposed to explain)
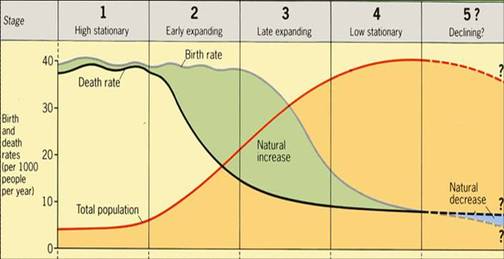
The Demographic Transition model explains the transformation of countries from having high birth and death rates to low birth and death rates using a process of four stages (now five). [the evolution of FERTILITY and MORTALITY over time]
Function: (how it is used)
It is used to understand population policies and changes in developed and less developed countries around the world over time.
Strengths:
Easy to apply to all countries even though rates vary due to cultural and economic conditions. Models available for all the countries of the world, although there is much variety in the way in which it applies.
Weaknesses:
Does not provide guidelines for how long it takes for a country to get from Stage 1 to Stage 3; has attracted criticism as a general model, doubt about the model’s validity and applicability; oversimplification. Developed in Europe and assumes that all states go through industrialization, in addition many states are reducing growth rate w/o increase in wealth . Some states are “stuck” in Stage 2 or Stage 3
Why doesn’t the pattern of Demographic Transition Model work for all countries?
Effectiveness in field in past and today:
In the past, developed countries began transitioning in the 18th century and continue today. Today the less developed countries began later and are still in the midst of earlier stages. Western European countries took centuries while rapidly developing countries (ie Asian Tigers) are transforming in decades.
American geographer, Warren Thompson, developed this model in 1929 in NYC in the midst of the stock market crash and onset of the Depression.
Premise: (What it is supposed to explain)
The Demographic Transition model explains the transformation of countries from having high birth and death rates to low birth and death rates using a process of four stages (now five). [the evolution of FERTILITY and MORTALITY over time]
Function: (how it is used)
It is used to understand population policies and changes in developed and less developed countries around the world over time.
Strengths:
Easy to apply to all countries even though rates vary due to cultural and economic conditions. Models available for all the countries of the world, although there is much variety in the way in which it applies.
- Its dynamic - it shows changes through time
- It describes what has happen in the UK and many other western countries have also been through the same stages
- Some countries are going through it at the moment - Newly Industrialised Countries, like South Korea
- Explains what has happened
Weaknesses:
Does not provide guidelines for how long it takes for a country to get from Stage 1 to Stage 3; has attracted criticism as a general model, doubt about the model’s validity and applicability; oversimplification. Developed in Europe and assumes that all states go through industrialization, in addition many states are reducing growth rate w/o increase in wealth . Some states are “stuck” in Stage 2 or Stage 3
Why doesn’t the pattern of Demographic Transition Model work for all countries?
- Based on events from the past
- Its had to have been adapted since it was used –Stage 5 was added
- Some LDCs have imported medicine/sanitation techniques from MDCs
- Does not give a timeline for how long it will take –260 years for UK but South Korea seems to be rushing through in decades
- It doesn’t take migration rates into account
- Many factors affect death rate such as; famine, natural disasters, war.
- It doesn’t show Governments/Non-Government intervention
- Countries census data could be inaccurate
- DTM assumes all countries will go through stages in a certain order. Many countries in Africa seem to be in Stage 5 due to the HIV and Aids epidemic.
Effectiveness in field in past and today:
In the past, developed countries began transitioning in the 18th century and continue today. Today the less developed countries began later and are still in the midst of earlier stages. Western European countries took centuries while rapidly developing countries (ie Asian Tigers) are transforming in decades.
Migration
The reasons that people migrate would be due to push and pull factors. Push and Pull factors are forces that can either induce people to move to a new location or oblige them to leave old residences; they can be economic, political, cultural, and environmentally based
|
|
|
Polish Migration to the UK 2007 to 2012
Migration has become a huge political issue in the United Kingdom and has been cited as one of the main reasons why the majority of British people voted to leave the EU. Tabloid newspapers and TV shows focused specifically on the influx of people from eastern Europe to the UK. In this activity we will assess the reasons for Polish people migrating to the UK and the impacts, both positive and negative it has had on the the UK.
