Population and Migration

During this unit we will consider the following questions:
- Why the world’s population is unevenly distributed?
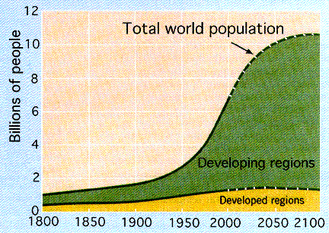
- What are the present and predicted trends in population growth?
- How do Population changes differ between countries?
- Why are some places over populated?
- What is the demographic transition model.? Why are some demographers suspect of its validity when applied to contemporary growth situations?
- Why do fertility rates and mortality rates differ from region to region and sometimes even within regions?
- What influences migration patterns?
Unit 2 Plan
| AP Unit 2 Plan Printable |
Inquiry Based Classroom Activities
|
World Population Presentation
|
Factors that affect population change
|
Population: Living graph
| ||||||
Migration: "Push" and "Pull" factors
As part if the AP Human Geography Course you must be able to evaluate the positive and negative impacts of international migration using one case study of a country. You must be able to understand and explain the numbers migrating, their origins and destination; and the impact of migration on services and the economy. As you know from our studies of migration from Mexico to the USA migration is the result of certain "Push" and "Pull" factors. For example, the "Pull" factors may include things like higher salaries, better education and healthcare, etc. Whereas "Push" factors are the things that cause people to leave Mexico (crime, low salaries, etc.
Case Study: Polish Migration to the UK.
In groups students will evaluate the ‘push’ and ‘pull’ factors to the UK as well as the positive and negative social and economic impacts on the UK.
|
|
| ||||||
The Demographic Transition Model

Person who developed the model/ theory: (short bio) Warren Thompson
American geographer, Warren Thompson, developed this model in 1929 in NYC in the midst of the stock market crash and onset of the Depression.
Premise: (What it is supposed to explain)
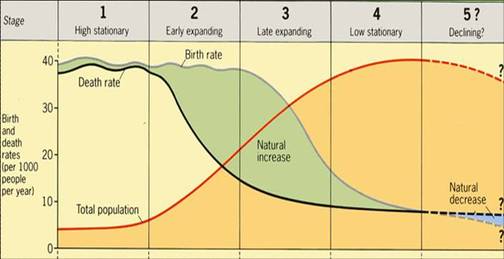
The Demographic Transition model explains the transformation of countries from having high birth and death rates to low birth and death rates using a process of four stages (now five). [the evolution of FERTILITY and MORTALITY over time]
Function: (how it is used)
It is used to understand population policies and changes in developed and less developed countries around the world over time.
Strengths:
Easy to apply to all countries even though rates vary due to cultural and economic conditions. Models available for all the countries of the world, although there is much variety in the way in which it applies.
Weaknesses:
Does not provide guidelines for how long it takes for a country to get from Stage 1 to Stage 3; has attracted criticism as a general model, doubt about the model’s validity and applicability; oversimplification. Developed in Europe and assumes that all states go through industrialization, in addition many states are reducing growth rate w/o increase in wealth . Some states are “stuck” in Stage 2 or Stage 3
Why doesn’t the pattern of Demographic Transition Model work for all countries?
Effectiveness in field in past and today:
In the past, developed countries began transitioning in the 18th century and continue today. Today the less developed countries began later and are still in the midst of earlier stages. Western European countries took centuries while rapidly developing countries (ie Asian Tigers) are transforming in decades.
American geographer, Warren Thompson, developed this model in 1929 in NYC in the midst of the stock market crash and onset of the Depression.
Premise: (What it is supposed to explain)
The Demographic Transition model explains the transformation of countries from having high birth and death rates to low birth and death rates using a process of four stages (now five). [the evolution of FERTILITY and MORTALITY over time]
Function: (how it is used)
It is used to understand population policies and changes in developed and less developed countries around the world over time.
Strengths:
Easy to apply to all countries even though rates vary due to cultural and economic conditions. Models available for all the countries of the world, although there is much variety in the way in which it applies.
- Its dynamic - it shows changes through time
- It describes what has happen in the UK and many other western countries have also been through the same stages
- Some countries are going through it at the moment - Newly Industrialised Countries, like South Korea
- Explains what has happened
Weaknesses:
Does not provide guidelines for how long it takes for a country to get from Stage 1 to Stage 3; has attracted criticism as a general model, doubt about the model’s validity and applicability; oversimplification. Developed in Europe and assumes that all states go through industrialization, in addition many states are reducing growth rate w/o increase in wealth . Some states are “stuck” in Stage 2 or Stage 3
Why doesn’t the pattern of Demographic Transition Model work for all countries?
- Based on events from the past
- Its had to have been adapted since it was used –Stage 5 was added
- Some LDCs have imported medicine/sanitation techniques from MDCs
- Does not give a timeline for how long it will take –260 years for UK but South Korea seems to be rushing through in decades
- It doesn’t take migration rates into account
- Many factors affect death rate such as; famine, natural disasters, war.
- It doesn’t show Governments/Non-Government intervention
- Countries census data could be inaccurate
- DTM assumes all countries will go through stages in a certain order. Many countries in Africa seem to be in Stage 5 due to the HIV and Aids epidemic.
Effectiveness in field in past and today:
In the past, developed countries began transitioning in the 18th century and continue today. Today the less developed countries began later and are still in the midst of earlier stages. Western European countries took centuries while rapidly developing countries (ie Asian Tigers) are transforming in decades.
Chapter 2 Reading
Review Materials
|
| ||||||||
|
A very useful population review game from the BBC
|
Population Review: True or False Questions
http://wps.prenhall.com/esm_rubenstein_humangeo_8/20/5323/1362796.cw/index.html Migration Review: True or False Questionshttp://wps.prenhall.com/esm_rubenstein_humangeo_8/20/5323/1362867.cw/index.html
| ||||
