1.7 Organizational planning tools
What we will study?
By the end of this unit you should be able to:
- Evaluate the value of a business using a given organisational planning tool.
- Apply a formal decision-making framework to a business situation
- Prepare a fishbone diagram analysis for a business situation
- Construct and interpret decision trees and evaluate this technique
- Examine the uses of Lewin's force-field analysis and the relative importance of driving and restraining forces
- Construct and interpret decision trees and evaluate this technique
- Apply decision-making processes and planning tools
Fishbone diagram
Purpose: To arrive at a few key issues that contribute most significantly to the problem being examined. These sources are then targeted for improvement.
The figure below shows a simple Ishikawa diagram. Note that this tool is referred to by several different names: Ishikawa diagram, Cause-and-Effect diagram, Fishbone diagram, and Root Cause Analysis. The first name is after the inventor of the tool, Kaoru Ishikawa (1969) who first used the technique in the 1960s.
The basic concept in the Cause-and-Effect diagram is that the name of a basic problem is entered at the right-hand end of the diagram, at the end of the main "bone".
The main causes of the problem (the effect) are drawn as bones off of the main backbone. Brainstorming is typically done to add possible causes to the main "bones" and more specific causes to the "bones" on the main "bones". This subdivision into ever increasing specificity continues as long as the problem areas can be further subdivided. The practical maximum depth of this tree is usually about four or five levels. When the fishbone is complete, one has a fairly complete picture of all the possibilities about what could be the root cause for the designated problem.
The Cause-and-Effect diagram can be used by individuals or teams; probably most effectively by a group. A typical utilization is the drawing of a diagram on a blackboard by a team leader who first presents the main problem and asks for assistance from the group to determine the main causes which are subsequently drawn on the board as the main bones of the diagram. The team assists by making suggestions and, eventually, the entire cause and effect diagram is filled out. Once the entire fishbone is complete, team discussion takes place to decide what are the most likely root causes of the problem. These causes are circled to indicate items that should be acted upon, and the use of the tool is complete
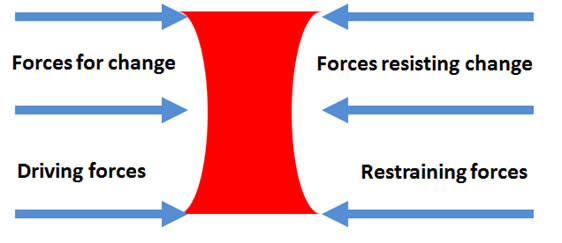
Lewin's Force Field Analysis
Many factors drive change in a business. Lewin identified four forces: In Lewin’s model there are forcesdriving change and forces restraining it. Where there is equilibrium between the two sets of forces there will be no change. In order for change to occur the driving force must exceed the restraining force
Lewin’s analysis can be used to:
- Investigate the balance of power involved in an issue
- Identify the key stakeholders on the issue
- Identify opponents and allies
- Identify how to influence the target group
|
Internal forces for change
A general sense that the business could “do better” Desire to increase profitabilityReorganisation to increase efficiency Natural ageing and decline in a business (e.g. machinery, products) Conflict between departments The need for greater flexibility in organisational structures Concerns about ineffective communication, de-motivation or poor business relationships |
External forces for change
Increased demands for higher quality and levels of customer service Uncertain economic conditions Greater competitionHigher cost of inputs Legislation & taxesPolitical interests Ethics & social valuesTechnological change Globalisation Scarcity of natural resources Changing nature and composition of the workforce |
Taken from Tutor2u.com
