1.1 Demand and Supply
What we will study?
By the end of this unit you should be able to:
- Explain the negative causal relationship between price and quantity demanded.
- Describe the relationship between an individual consumer’s demand and market demand.
- Distinguish between movements along the demand curve and shifts of the demand curve.
- Draw diagrams to show the difference between movements along the demand curve and shifts of the demand curve.
- Explain how factors including changes in income (in the cases of normal and inferior goods), preferences, prices of related goods (in the cases of substitutes and complements) and demographic changes may change demand
- Explain the positive causal relationship between price and quantity supplied.
- Describe the relationship between an individual producer’s supply and market supply.
- Explain that a supply curve represents the relationship between the price and the quantity supplied of a product, ceteris paribus.
- Draw a supply curve.
- Explain how factors including changes in costs of factors of production (land, labour, capital and entrepreneurship), technology, prices of related goods (joint/competitive supply), expectations, indirect taxes and subsidies and the number of firms in the market can change supply.
- Distinguish between movements along the supply curve and shifts of the supply curve.
- Explain, using diagrams, how demand and supply interact to produce market equilibrium.
- Analyze, using diagrams and with reference to excess demand or excess supply, how changes in the determinants of demand and / or supply result in a new market equilibrium.
Demand
This section of the IB Economics course we outline what a market is and then examines the forces of supply and demand. These twin forces lie at the heart of the market-based economy.
Demand and Supply Topics:
Demand and Supply Topics:
- Demand
- Supply
- Market equilibrium: demand and supply
- The role of the price mechanism and market efficiency
What is demand?

The want or willingness of consumers to buy a product. To be an effective demand a consumer must have enough money to buy the product. The amount of a good or service consumers are willing and able to buy is known as the quantity demanded of that product. Economists measure the quantity demanded of a particular good or service at a certain price over certain periods of time, e.g. the number of oranges bought per week. Individual demand is the demand of one consumer, while market demand for a product is the total demand for that product from all of its consumers
Demand Curves
The demand curve is a graph illustrating how much of a given product a household would be willing to buy at different prices
Key Point Summary
•Consumer demand for a given product is the want or willingness of consumers to buy that product. An effective demand only exists when consumers have sufficient money to buy the products
•The market demand for a good or service is the total effective demand of all consumers willing and able to buy that product
•Individual and market demand curves are downward sloping. As price rises, demand contracts. As price falls, demand extents as consumer can afford to buy more with their income.
Demand Curves
The demand curve is a graph illustrating how much of a given product a household would be willing to buy at different prices
- As price rises, the quantity demanded by consumers contracts
- As price falls, the quantity demanded by consumers extends
- A demand curve slopes downwards
Key Point Summary
•Consumer demand for a given product is the want or willingness of consumers to buy that product. An effective demand only exists when consumers have sufficient money to buy the products
•The market demand for a good or service is the total effective demand of all consumers willing and able to buy that product
•Individual and market demand curves are downward sloping. As price rises, demand contracts. As price falls, demand extents as consumer can afford to buy more with their income.
Movement Along The Demand Curve = A change in the quantity demanded
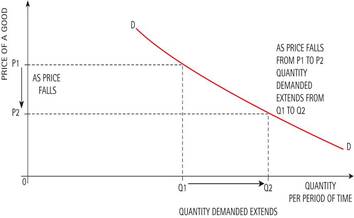
A change in price of a good or service leads to:
- Change in quantity demanded
A Shift In The Demand Curve
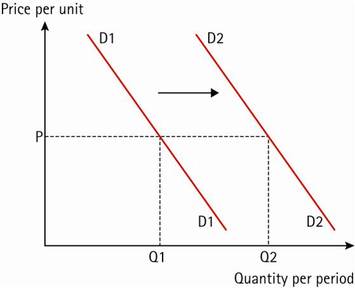
Change in income, preferences, or prices of other goods or services
leads to:
leads to:
- Change in demand
- Possible causes are:
an increase in disposable incomes after tax - a rise in the price of substitutes •
- a fall in the price of a complement
- •tastes and fashion favour the product
- •an increase in advertising •
- a rise in the population •
- other factors, e.g. hot weather increases demand for cold drinks and sun creams
Movement along the supply curve = A change in the quantity supplied
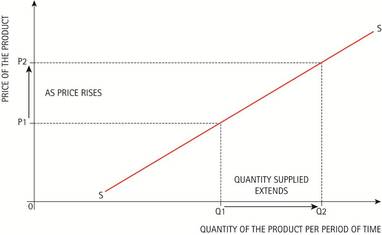
A change in price causes a movement along the curve
- The higher the price of a product, the more suppliers will produce..
- If the price rises then supply will rise, this is known as anexpansion in supply.
- The lower the price of a product the less will be supplied.
- If the price falls then supply will fall, this is known as an contraction in supply.
A Shift in the Supply Curve
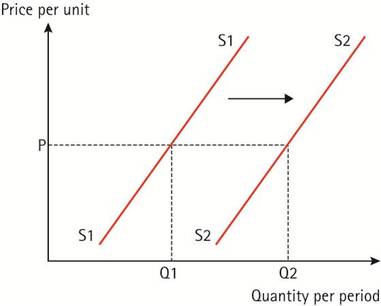
A shift in the supply curve represents an increase or decrease in the quantity supplied at each and every price level. Several factors that can cause a shift in supply:
- Improvements in technology (can increase efficiency & reduce costs).
- Weather, climate and disease (especially agricultural products).
- Taxes and subsidies can make the costs of production more/less expensive and therefor increase or decrease supply.
- Natural disasters & wars can severely disrupt supply.
- Resources: discoveries of new resources or depleting reserves of resources can affect the supply of products..
Useful videos
|
|
|
|
|
|
|
|
